
Requirements
All the log collectors tried below will be using Elasticsearch as the backend system and Kibana as it’s web interface.
Installed Elasticsearch and Kibana
Elasticsearch as a storage for the logs and Kibana as the Elasticsearch user interface. We’re going to need them as they come so just download from the official website.
Let’s just run them both with the following commands. (*nix/macos)
$ ./bin/elasticsearch
$ ./bin/kibana
Fluentd
This tool comes with a service that needs to be installed in the system; td-agent.
td-agent is a tool that collects the logs and conveys them to a storage system, in this case Elasticsearch. I was able to set it up and use as inputs the system log and a rest API that fluent listens to.
To make it work with Elasticsearch I had to install a plugin used to connect the two tools together. Fluentd installation guide is very straightforward.
I can send logs to Fluentd and visualize them in Elasticsearch in the following ways:
$ curl -X POST -d ‘json={“message”:”message2", “ident”: “rest”}’ http://localhost:8888/td.rest.test
the configuration for this listener in the Fluentd is done as follows in
/etc/td-agent/td-agent.conf
An input is configured:
# HTTP input
# POST http://localhost:8888/<tag>?json=<json>
# POST http://localhost:8888/td.rest.login?json={"user"%3A"me"}
# @see http://docs.fluentd.org/articles/in_http
<source>
  @type http
  @id input_http
  port 8888
</source># live debugging agent
<source>
  @type debug_agent
  @id input_debug_agent
  bind 127.0.0.1
  port 24230
</source>
And then a match which is used to send data to Elasticsearch
<match td.rest.*>
  @type elasticsearch
  logstash_format true
  <buffer>
    flush_interval 10s # for testing
  </buffer>
</match>
To send a system log to Fluentd just run:
$ logger -t test foobar22
Also in this case there is an input section and a match section in the configuration file.
#get logs from syslog
<source>
  @type syslog
  port 42185
  tag syslog
</source><source>
  @type forward
</source><match syslog.**>
  @type elasticsearch
  logstash_format true
  <buffer>
    flush_interval 10s # for testing
  </buffer>
</match>
With Fluentd filters can be used to transform the logs in input before saving them. There are not a lot of predefined filters but new plugins can be developed to extend Fluentd.
Output sources:
- out_copy
- out_null
- out_roundrobin
- out_stdout
- out_exec_filter
- out_forward
- out_mongo or out_mongo_replset
- out_exec
- out_file
- out_s3
- out_webhdfs
For integration with Elasticsearch
$ sudo /usr/sbin/td-agent-gem install fluent-plugin-elasticsearch — no-document
Bottomline
Documentation: PoorCommunity: Poor
Distributed extensions
Personally had some issues setting it up; not straightforward.
fluentd-ui helps a bit with the setup.
Graylog
Prerequisites:
- Java (>= 8)
- MongoDB (>= 2.4)
- Elasticsearch (>= 2.x)
Installation is somewhat tricky by just following the documentaion. A few missing steps in the documentation led to erros when trying to set up the system.
It was necessary to insert a password secret and a sha2 hashed password for the root admin in the configuration file.
$ systemctl start graylog-server
Configuration file: /etc/graylog/server/server.conf
Web UI reachable from the browser at: http://localhost:9000
This solution needs Mongodb and Elasticsearch as specified also above but it doesn’t need Kibana to visualise the data, because it offers it’s own UI.
From the web interface it’s possible to fully manage the Graylog system.
- Manage input sources
- Manage extractors (methods to transform, show and extract messages)
- Configure alerts
All configurations are done directly through the web interface; input sources, transformations, outputs, alerts and so on. It is a full- stack environment.
Pipelines can be created to build a chain of transformations to log messages.
Plugins can be written to customly handle
- Inputs: Accept/write any messages into Graylog
- Outputs: Forward ingested messages to other systems as they are processed
- Services: Run at startup and able to implement any functionalities
- Alert Conditions: Decide whether an alert will be triggered depending on a condition
- Alert Notifications: Called when a stream alert condition has been triggered
- Processors: Transform/drop incoming messages (can create multiple new messages)
- Filters: (Deprecated) Transform/drop incoming messages during processing
- REST API Resources: An HTTP resource exposed as part of the Graylog REST API
- Periodical: Called at periodical intervals during server runtime
- Decorators: Used during search time to modify the presentation of messages
- Authentication Realms: Allowing to implement different authentication mechanisms (like single sign-on or 2FA)
Nice overall impression. It comes with many tools out of the box but has to be configured.
Bottomline
Documentation: Tricky
Overall impression: fully fledged
Offers a great tool for managing logs. In fact is considered a log manager rather than a log collector
Logstash
Installation and setup is easy by following through the documentation provided online.
Can be integrated with different input sources out of the box and accepts complex filters to manage and extract data from messages. Grok patterns can be used, like in Graylog, to extract data from log messages. Messages are sent to Elasticsearch and visualized with Kibana.
Easy to configure but doesn’t offer a UI tool for the configuration but a config file (or set of files).
$ ./bin/logstash -f config/logstash.conf
{put here own logstash configuration … }
Bottomline
Documentation: Tricky
Considered one of the two most popular options (the other being fluentd)
Beautifully integrated with elasticsearch, kibana and elastic beats
Overall impression: works pretty nice especially with filebeat
Must enable the option to have a persistent layer of events because the fixed size of the event queue that can handle only 20 events might not be sufficient.
Beats
Filebeat, Heartbeat, Metricbeat, Auditbeat
Filebeat
Is a nice system that reads from many different sources at the same time and feeds one or more outputs. I tried it with Logstash, made it read all the log files in
– /var/log/*.log
and it seems to handle the stream very well.
Run
$ sudo filebeat -e -c /etc/filebeat/filebeat.yml
Outputting the FileBeat stream directly to Elasticsearch works as well but the data, although already a bit structured, cannot be transformed and extracted as it can through Logstash Filters.
Filebeat ensures at-least-once-delivery for messages to the defined output source.
Documentation: Good
Heartbeat
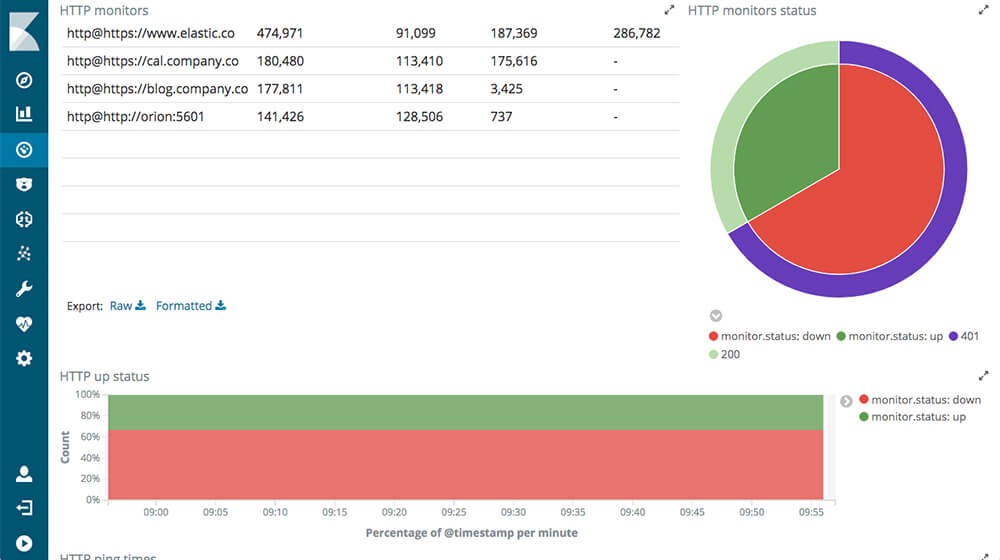
It’s an elastic beat exclusively designed to monitor uptime. It continuously pings the configured web resources through http. The preconfigured setup monitors a local Elasticsearch installation at http://127.0.0.1:9200.
$ sudo heartbeat -e -c /etc/heartbeat/heartbeat.yml
Configuration: Easy
Documentation: Trivial
Metricbeat
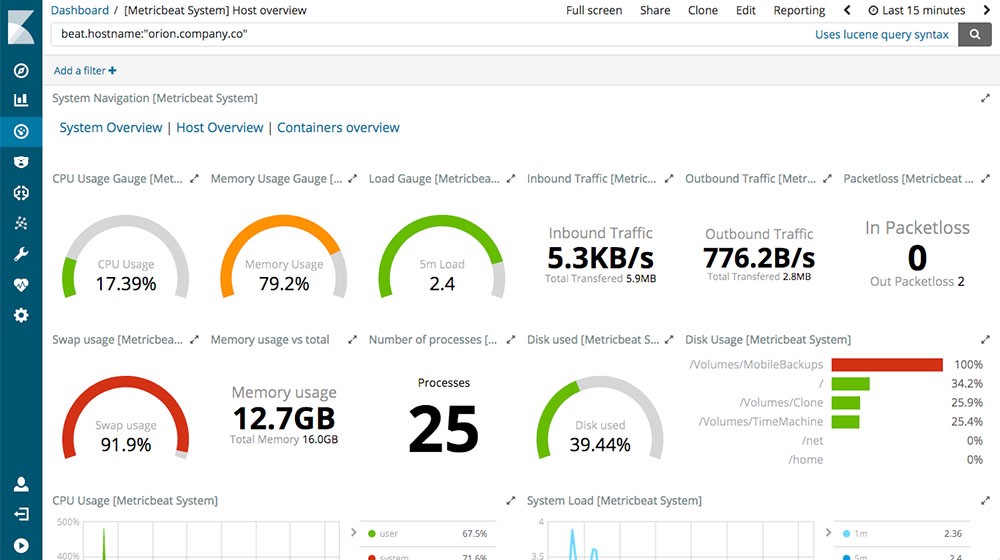
Collect metrics from your systems and services. From CPU to memory, Redis to NGINX, and much more, Metricbeat is a lightweight way to send system and service statistics. Kind of the same reporting/monitoring that Icinga does. We’ll get to it in a bit.
$ sudo metricbeat -e -c /etc/metricbeat/metricbeat.yml
Configuration: Easy
Documentation: Trivial
Auditbeat

Collecting audit Linux data and monitoring file integrity through the system. Comes along with Kibana predefined dashboards as do other beats.
To install the available Kibana dashboards, ensure that Kibana is up and running and then run the following:
$ sudo auditbeat setup -e [-c /etc/auditbeat/auditbeat.yml]
Same command to install the available dashboards is available for all beats. Generally every Beats comes with predefined dashboards that visualise log data beautifully.
To run Auditbeat:
$ sudo auditbeat -e -c /etc/auditbeat/auditbeat.yml
Bottomline
Configuration: Easy
Documentation: Trivial
Beautiful integration with kibana and the predefined dashboards and visualisations are awesome
Only downside is that I didn’t figure out how to use the predefined dashboards if I make the logs go through logstash first
Icinga2
Icinga 2 is an open source monitoring system which checks the availability of your network resources, notifies users of outages and generates performance data for reporting.
Prerequisites:
$ apt-get install monitoring-plugins
Installation is easy. It’s just enough to add the package repository for it and then install the icinga2 package. It’s not that immediate to make it work right away because there are some external plugins that need to be installed as well.
Icinga is used to check Hosts and Services so it’s a service monitoring system.
Configuration seems simple but there are too manz files and the documentations desn’t explain completely how to set up the environment.
Offers an API interface for configuration but no UI out of the box.
It can be integrated with Elasticsearch / Logstash through an ElasticBeets component.
The UI can be installed but needs:
- mysql
- apache2 (web server)
- php
It can be reached at: http://localhost/icingaweb2
It has a lot of configuration files and a lot of checkers.
Bottomline
Documentation: Somewhat incomplete
Fork from nagios. The out-of-the-box configuration gives a really great system monitoring service but it?s not a log collector. It’s a monitoring system that can be used to check and keep under surveillance the state of different network objects
I also created a simple Java application and a simple nodejs application. Both applications are just producing logs of different levels continuously.
run with gradle clean run
In the java app I’ve configured with logback different appenders:
- Log file
- Log file with logs formatted in JSON
- UDP Gelf formatted logs sent to Graylog
- Logs sent to Logstash
I configured Logstash to read the log files. I made the first one pass through some filters using a GROK pattern I defined. For the second one I just defined it as a JSON type of log. Logstash manages to identify the fields by itself this way. Just to mix things up, the Graylog server stores log messages on my Elasticsearch instance.
So basically, from the same logs produced by my java application and outputted in 4 different ways, I end up with 4 indexes on Elasticsearch that have the same data. This to compare the differences of the various methods.
Opinion first: JSON formatted logs where better structured. GROK parsing eventually ends up in failures every now and again.
I created a dashboard displaying the same data for the four indexes put together. Basically the charts I created shows the count for each error level logged.
Because of the GROK failures some were missing in the plain text log file case. In the others was easier to play around.
Eni Sinanaj
JIT Senior Software Engineer
Photo by Stephen Dawson on Unsplash